 Douleur - Allodynie/Hyperalgésie Thermique
 Douleur - Spontanée - Déficit de Posture
 Douleur - Allodynie/Hyperalgésie Mécanique
 Apprentissage/Mémoire - Attention - Addiction
 Physiologie & Recherche Respiratoire


 Douleur
 Système Nerveux Central (SNC)
  Neurodégénérescence
 Système sensoriel
 Système moteur
 Troubles de l'humeur
 Autres pathologies
 Système musculaire
 Articulations
 Métabolisme
 Thématiques transversales
 Congrès & Meetings 2026
 Authors
Hsin-Pin Lin, Jennifer D Petersen, Alexandra J Gilsrud, Angelo Madruga, Theresa M D'Silva, Xiaoping Huang, Mario K Shammas, Nicholas P Randolph, Kory R Johnson, Yan Li, Drew R Jones, Michael E Pacold, Derek P Narendra
Lab
Journal
The EMBO Journal
Abstract
(A) Model depicts predicted effects of the DELE1 mt-ISR on protein translation including acute inhibition of translation initiation by pS51-eIF2Alpha, resumption of protein initiation following the transcriptional upregulation ofEif3c, and facilitation of translation elongation through increased production of protein synthesis intermediates by the coordinated upregulation of (1) genes related amino biosynthesis and transport, (2) Xpot to mediate tRNA export from the nucleus to the cytosol, and (3) aminoacyl-tRNA synthases (aaRSs) to promote aminoacyl conjugation to tRNAs. Protein translation dynamics and fidelity can affect the proportion of newly translated proteins that fold properly vs. misfold. (B,C) Measurement of in vivo protein synthesis in C10 G58R;Dele1KO mice and indicated littermates at P21 and P28, using the SUnSET assay. Blot for P21 timepoint is shown in (B). Mice were injected with the aminoacyl-tRNA ortholog, puromycin, sacrificed 30min later, and puromycin incorporation into newly synthesized polypeptides in heart and gastrocnemius tissue lysates was measured by immunoblotting. Statistical analysis performed using Welch ANOVA and Dunnett's T3 multiple comparisons test. (Top graph, heart, Day 21) adjustedp-values were 0.4894 for C10 WT; Dele1+ vs. Dele1 KO, 0.0236 for C10 WT; Dele1+ vs. C10 G58R; Dele1+, 0.5341 for C10 WT; Dele1+ vs. C10 G58R; Dele1 KO, and 0.9978 for C10 G58R; Dele1+ vs. C10 G58R; Dele1 KO. (Top graph, heart, Day 28) adjustedp-values were 0.8419 for C10 WT; Dele1+ vs. Dele1 KO, 0.8923 for C10 WT; Dele1+ vs. C10 G58R; Dele1+, 0.2250 for C10 WT; Dele1+ vs. C10 G58R; Dele1 KO, and 0.4979 for C10 G58R; Dele1+ vs. C10 G58R; Dele1 KO. (Middle graph, gastroc, Day 21) adjustedp-values were 0.9990 for C10 WT; Dele1+ vs. Dele1 KO, 0.1338 for C10 WT; Dele1+ vs. C10 G58R; Dele1+, 0.0136 for C10 WT; Dele1+ vs. C10 G58R; Dele1 KO, and 0.7086 for C10 G58R; Dele1+ vs. C10 G58R; Dele1 KO. (Middle graph, gastroc, Day 28) adjustedp-values were 0.9841 for C10 WT; Dele1+ vs. Dele1 KO, 0.9399 for C10 WT; Dele1+ vs. C10 G58R; Dele1+, 0.7107 for C10 WT; Dele1+ vs. C10 G58R; Dele1 KO, and 0.8419 for C10 G58R; Dele1+ vs. C10 G58R; Dele1 KO. (Top graph, gastroc/heart ratio, Day 21) adjustedp-values were 0.9999 for C10 WT; Dele1+ vs. Dele1 KO, 0.6361 for C10 WT; Dele1+ vs. C10 G58R; Dele1+, 0.2390 for C10 WT; Dele1+ vs. C10 G58R; Dele1 KO, and 0.1941 for C10 G58R; Dele1+ vs. C10 G58R; Dele1 KO. (Top graph, gastroc/heart ratio, Day 28) adjustedp-values were 0.8820 for C10 WT; Dele1+ vs. Dele1 KO, 0.4304 for C10 WT; Dele1+ vs. C10 G58R; Dele1+, 0.3415 for C10 WT; Dele1+ vs. C10 G58R; Dele1 KO, and 0.1941 for C10 G58R; Dele1+ vs. C10 G58R; Dele1 KO. In all graphs, * indicatespto¤0.05 and ns not significant.Nto¥ 4 mice per group (genotype). Error bars represent SD. (D) Representative immunofluorescence images of gastrocnemius muscle from P28 C10 G58R; Dele1 KO mice and indicated littermates, showing fibers with many or confluent aggregates of ubiquitinated proteins co-localized with the aggregate-forming adapter protein p62, suggesting proteostatic collapse (arrowheads) in low power (20x) images (top panels). Scale bars = 50m. (E) Quantification of (D).N=3 mice per genotype with 30 low power fields counted per genotype. Low-power field size was 397.75m x 397.75m. Statistical analysis performed using ordinary one-way ANOVA with id¡k's multiple comparisons test, with a single pooled variance.N=3 in each group.P=0.8857 for C10 WT; Dele1+ vs. C10 WT; Dele1 KO.P=0.6605 for C10 WT; Dele1+ vs. C10 G58R; Dele1+. ns = non-significant. ****=<0.0001. Error bars represent SD. (F) Representative immunofluorescence images of gastrocnemius muscle from P28 C10 G58R;Dele1KO mice injected with puromycin 30min prior to sacrifice as in (B). Muscle cross-sections were immunostained for ubiquitinated proteins (using the FK2 antibody) (green), puromycin (red), and laminin (blue). Arrowheads indicate muscle fibers containing many or confluent aggregates of ubiquitinated proteins that were also co-stained for elevated puromycylated polypeptides. Arrows indicate individual aggregates of ubiquitin proteins that also contain puromycylated polypeptides. Scale bars = 20m. (G,H) Quantification of (F). Individual myofibers were automatically segmented using the Laminin immunofluorescence to define the myofiber border. Average puromycin fluorescence intensity and cross-sectional area (CSA) were measured for each myofiber. Separately myofibers were manually scored as containing many or confluent aggregates of ubiquitinated proteins (Ub+ or Ub- muscle fibers, respectively). The average puromycin intensity for Ub+ and Ub- myofiber is shown in graph separately for three mice (m1-3).N=3 mice with 10 high power fields counted per mouse. The scatterplot in (H) shows the relationship between myofiber CSA and puromycin intensity for all myofibers analyzed in (G). Fibers with CSA<50m were excluded from analysis. Statistical anal
Keywords/Topics
Mitochondria Unfolded Protein Response ( mt - UPR ); Mitophagy;Mitochondrial Disorders ; Mitonuclear Communication ;Mitohormesis
BIOSEB Instruments Used:
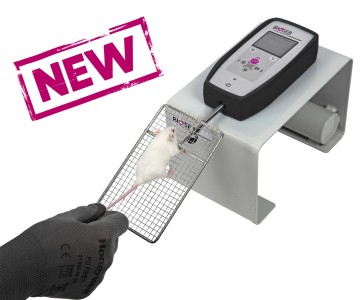
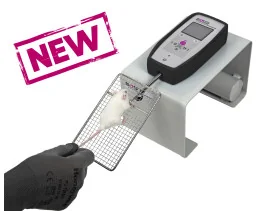
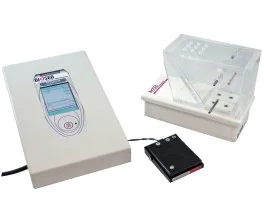
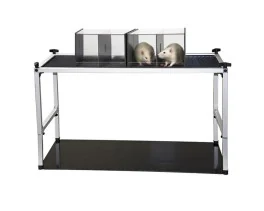
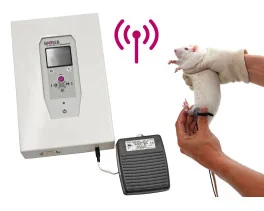
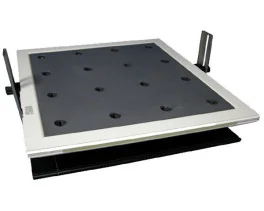
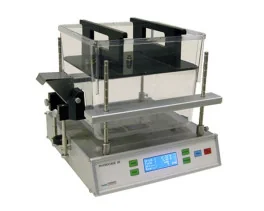
Grip strength test (BIO-GS4)
Source :