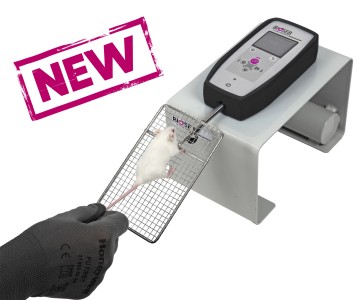
 Activité, Système Moteur & Coordination
 Douleur - Allodynie/Hyperalgésie Thermique
 Douleur - Spontanée - Déficit de Posture
 Douleur - Allodynie/Hyperalgésie Mécanique
 Anxiété & Dépression
 Apprentissage/Mémoire - Attention - Addiction
 Physiologie & Recherche Respiratoire
 Métabolisme & Nutrition



 Douleur
 Système Nerveux Central (SNC)
  Neurodégénérescence
 Système sensoriel
 Système moteur
 Troubles de l'humeur
 Autres pathologies
 Système musculaire
 Articulations
 Métabolisme
 Thématiques transversales
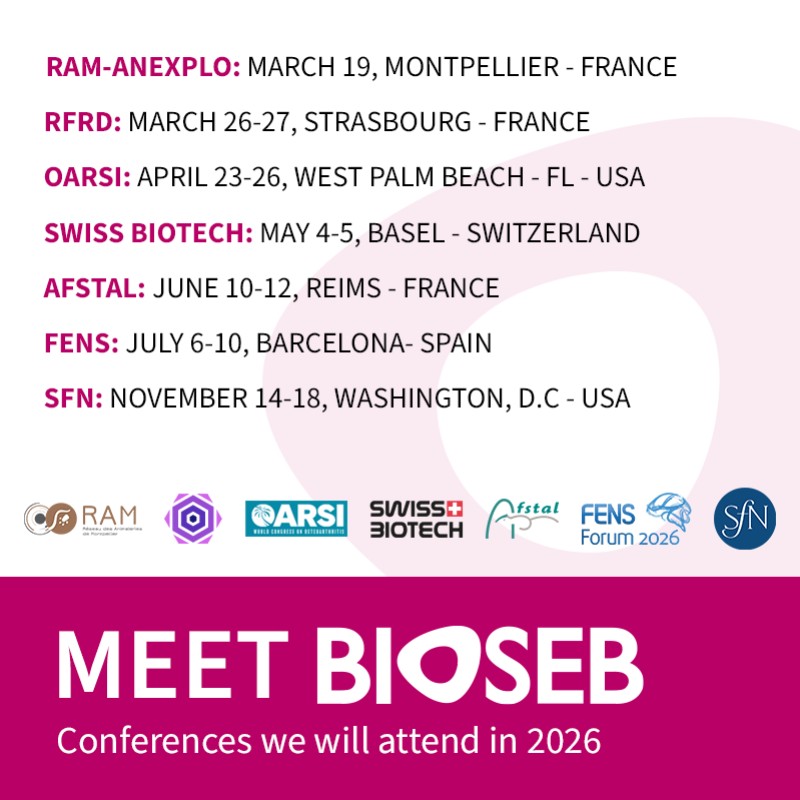 Congrès & Meetings 2026
 Authors
Hsin-Pin Lin, Jennifer D Petersen, Alexandra J Gilsrud, Angelo Madruga, Theresa M D'Silva, Xiaoping Huang, Mario K Shammas, Nicholas P Randolph, Yan Li, Drew R Jones, Michael E Pacold, Derek P Narendra
Lab
Journal
bioRxiv
Abstract
Mitochondria were auto-segmented using MitoNet, a deep learning segmentation model, operated with Python software, using the napari plungin, called empanda (Conrad & Narayan, 2023). Structural features of mitochondria in TEM images were analyzed from two mice of each genotype (except for theTfammKO for which only one littermate of control andTfammKO, Dele1 KO were available). To carry out the analysis, images of at least two areas of tissue for each littermate were recorded at 2000 x direct magnification which encompassed a 550 m2field of view (examples for each genotype are shown inSupplemental Fig. 4-7). These areas were selected based on being located towards the interior of the tissue away from edges cut during dissection, and areas where the plane of the thin section was semi-longitudinal with respect to the muscle fibers, rather than transversely oriented. Within these areas, images of at least five subareas were acquired at 5000 x direct magnification, each of which encompassed an 87 m2field of view (examples are shown inSupplemental Fig. 4-7). Two or more of these 5000 x images were randomly selected for structural analysis using MitoNet segmentation. For each image, labels were automatically assigned to mitochondria detected in the TEM image by empanada-napari. The segmentation labels were manually proofread and corrected as needed and then the set of labels for each image was used to log the size features of each mitochondria including area, major and minor axis lengths, and aspect ratio into Excel (Microsoft Corporation, Redmond WA, USA). A minimum of 600 mitochondria per genotype were analyzed. The same labels created in empanada-napari were used to tabulate ultrastructural features of individual mitochondria in the control and mutant genotypes. With labels overlayed on the TEM image, each mitochondrion was examined and manually scored as normal or abnormal, and structural features noted in the Excel file that also contained the shape features logged for each mitochondrion. The percent of mitochondria with various structural features per genotype were graphed using GraphPad Prism 10.1.0 (316) version for Windows (GraphPad Software, Boston, MA, USA,www.graphpad.com).
Keywords/Topics
promotes;translation-associated;homeostasis;growth;survival;mitochondrial;myopathy;mitochondria;auto-segmented;mitonet
BIOSEB Instruments Used:
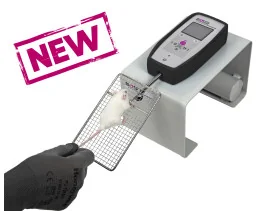
Grip strength test (BIO-GS4)
Source :