 Activité, Système Moteur & Coordination
 Douleur - Allodynie/Hyperalgésie Thermique
 Douleur - Spontanée - Déficit de Posture
 Douleur - Allodynie/Hyperalgésie Mécanique
 Anxiété & Dépression
 Apprentissage/Mémoire - Attention - Addiction
 Physiologie & Recherche Respiratoire
 Métabolisme & Nutrition
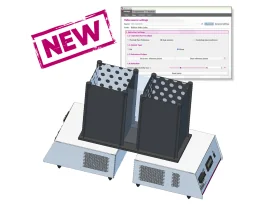
Kits contextuels pour T2CT - Double aversion & CPP
Les Kits contextuels pour T2CT ont été conçus pour enrichir les études de préférence de place...

Les Kits contextuels pour T2CT ont été conçus pour enrichir les études de préférence de place...
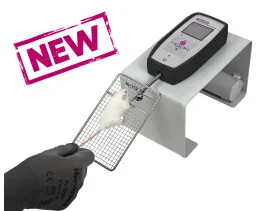
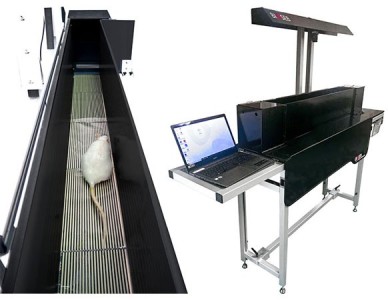
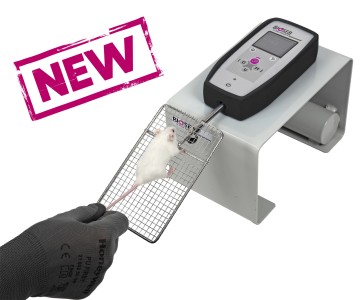
Une méthode simple pour quantifier objectivement la force musculaire des rats et souris et...
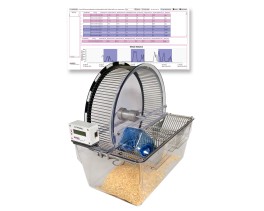
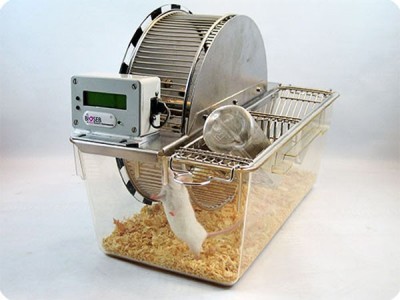
La roue d'activité spontanée BIOSEB offre une solution efficace pour quantifier l'activité...
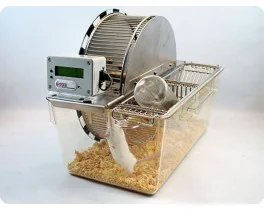
La Roue Instrumentée pour Exercice Spontané est une méthode simple pour mesurer l'activité...
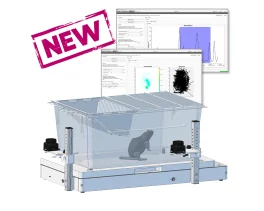
Une façon simple pour mesurer l'activité des rongeurs sur plusieurs jours dans leurs cages de...
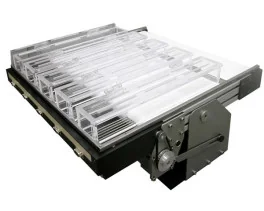
Conçu pour les études sur l'entraînement physique et la fatigue chez les rongeurs - et désormais...
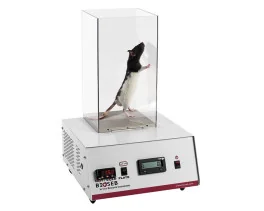
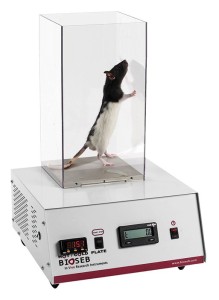
Instrument de test de la sensibilité de l'animal à la douleur résultant de l'exposition à la...
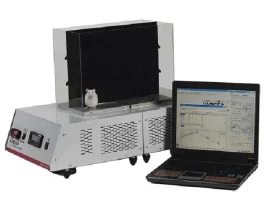
Un test indépendant de l'opérateur pour étudier les seuils de douleur chez les rongeurs (rats et...

Le Test de Gradient Thermique indépendant de l'opérateur est un nouvel instrument de recherche...
Les Kits contextuels pour T2CT ont été conçus pour enrichir les études de préférence de place...
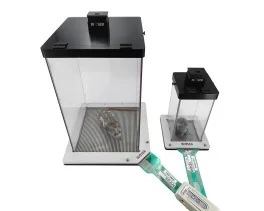
Un système permettant l'analyse de la posture des animaux par la répartition du poids sur...
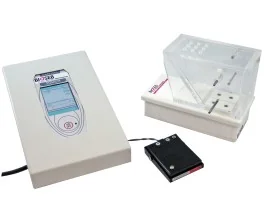
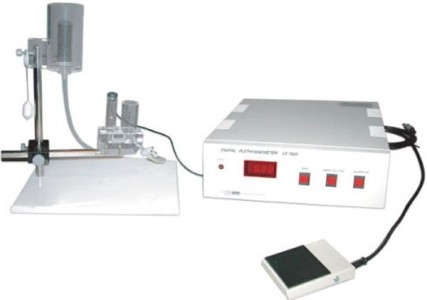
Test non douloureux pour mesurer le niveau d'inconfort (incapacitance) de petits animaux comme...
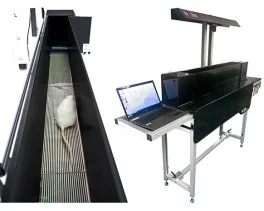
Un instrument unique qui ne fournit pas seulement la mesure indépendante et automatisée du poids...
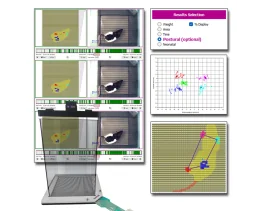
Étendez votre analyse grâce à des calculs posturaux et locomoteurs avancés Le système de...
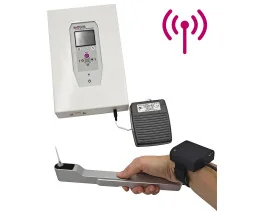
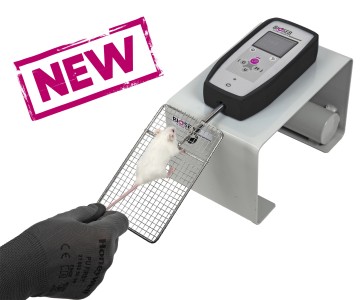
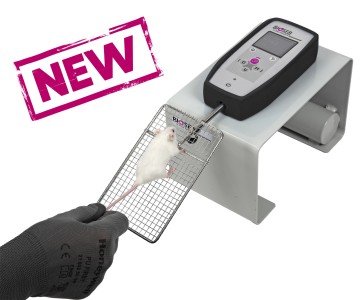
Une solution rapide pour déterminer le seuil de sensibilité à la douleur mécanique chez les...
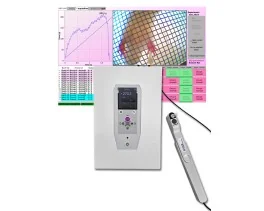
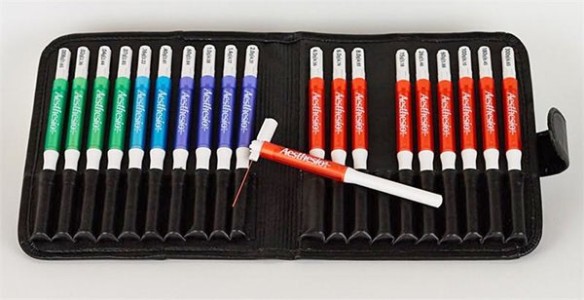
En tant que version électronique du classique esthésiomètre à filaments de Von Frey, la...
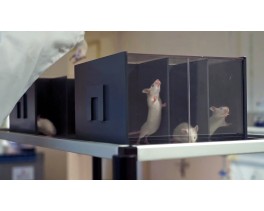
Nouvelles cage de contention modulables ROBUSTES pour maintenir doucement les rongeurs (rats et...
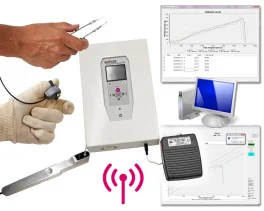
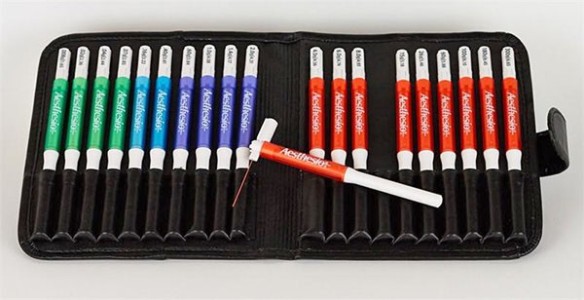
Une solution économique et versatile pour les situations nécessitant des tests sensoriels...
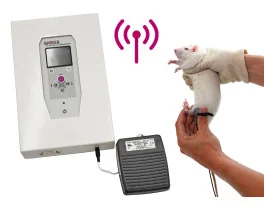
Dédié aux petits animaux tels que les rats et les souris, le Smalgo est un algomètre (ou...
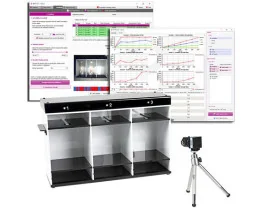
La version 5 du Test de Suspension Caudale de Bioseb, basée sur des capteurs de force ainsi que...
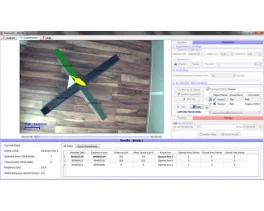
NOUVEAU ! Solution complète (matériel et logiciel), dédiée et automatisée pour le Labyrinthe...
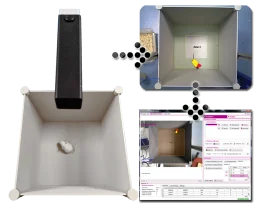
Un nouveau système innovant pour l'automatisation du test d'Open Field pour rats et souris:...

Test open-field - ARENE UNIQUEMENT utilisé pour évaluer l'activité basale des rongeurs (rats et...

Le nouveau Test de Nage Forcée Bioseb DUAL SENSOR à été développé selon une double approche: En...
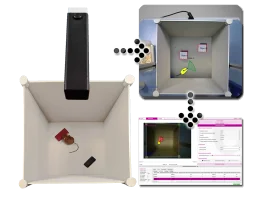
Un nouveau système innovant pour l'automatisation du test de Reconnaissance d'Object ("Novel...
Test open-field - ARENE UNIQUEMENT utilisé pour évaluer l'activité basale des rongeurs (rats et...
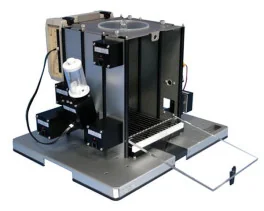
Un système expérimental d'enclos entièrement modulable conçu pour conduire des procédures de...
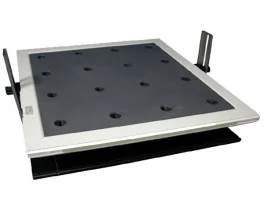
Appareil d'utilisation très simple pour souris Possibilité de sortir les données sur PC
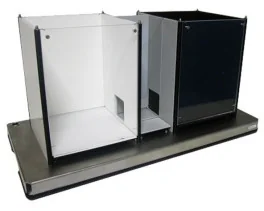
Une chambre expérimentale standard pour l'évaluation automatisée ou manuelle de la préférence de...
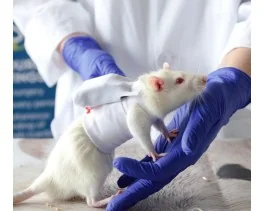
Mesures des paramètres physiologique en temps réel chez le rats - non invasive et sans aucune...
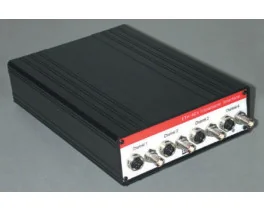
L'ETH-401 est un amplificateur de pont pour différents transducteurs qui fournit quatre canaux...
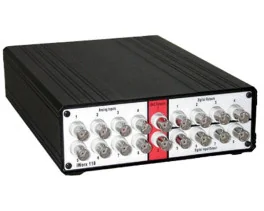
Le IX-118 est un système d'acquisition de données rapide 100 kHz à haute résolution et approprié...
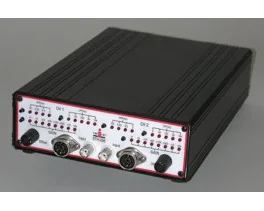
L'ETH-256 est un amplificateur 2 canaux haute performance à usage général de la recherche en...
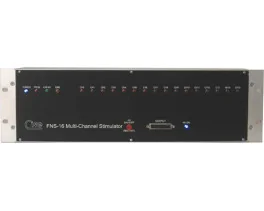
Stimulateur à canaux multiples toutes options pour stimulation neuro-musculaire
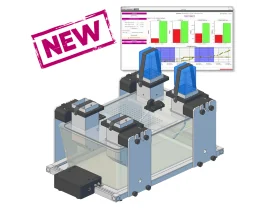
Découvrez BIO-FOODIS, la solution de nouvelle génération pour comprendre le comportement...
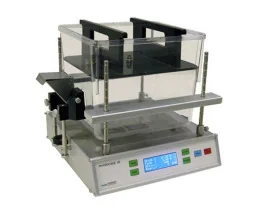
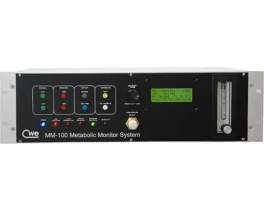
Système modulaire permettant l'intégration du métabolisme respiratoire, de l'apport de...
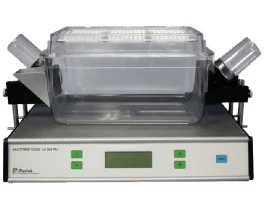
Équipements innovants et appropriés pour mesurer la consommation de nourriture / boisson ainsi...
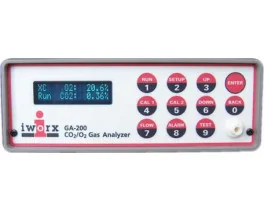
Un analyseur d'oxygène et de dioxyde de carbone économique, de haute performance avec des taux...
 Dernière publication 29/02/2024
Mitochondria were auto-segmented using MitoNet, a deep learning segmentation model, operated with Python software, using the napari plungin, called...
En lire plusFiltres
 Douleur
 Système Nerveux Central (SNC)
 Neurodégénérescence
 Système sensoriel
 Système moteur
 Troubles de l'humeur
 Autres pathologies
 Système musculaire
 Articulations
 Métabolisme
 Thématiques transversales
 Congrès & Meetings 2026


 [img_empty] => /var/www/vhosts/de3310.ispfr.net/bioseb2024/modules/prestablog/views/img/product_link_white.jpg
[image_presente] => 1
[link] => https://bioseb.com/fr/activite-systeme-moteur-coordination/48-grip-strength-test.html
)
)
)
1